
Analyzing Financial Statements: The Horizontal Method
The second method to analyze financial statements is the horizontal method. The horizontal method is used to analyze financial information in two fiscal years.
This method consists of comparing various financial statements, and it has a comparative evaluation between two years as less to identify the evolution of different accounts.
The method involves increasing and decreasing, a technique used to compare similar concepts on different dates. The object is to locate differences or inconsistent and analyze the accounts’ behavior year by year.
We determine if the variation is positive (increase) or negative (decrease).
To ensure a good analyze we recommend following the following steps:
Step #1
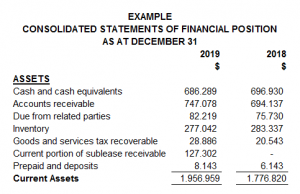
Having the financial statements in an Excel format will make it easier for the necessary calculations. Make sure you include the complete accounts next to their amounts and the two years correspondence. In the following example, we can see how it must look.
 |
Step #2
Include two columns next to the amounts inserted; the first one will be used to present the increases and decreases, and the second one will show the percentages.
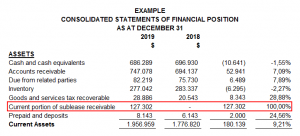
The horizontal method takes each account’s value from the last year minus each account’s worth from the previous year.
For example, cash and cash equivalents from 2019 minus cash and its equivalents from 2018, as we can see as follow:
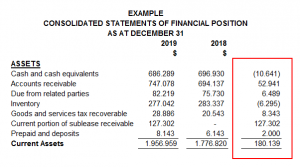 |
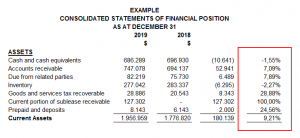
Then, the result is divided by the total of the account from the last year. In this case, the result was divided by the total cash and cash equivalent from 2019 (the most recent year), obtaining 1.55%.
 |
Step #3
Once the percentages have been obtained, the user of the financial statements can select the account with more variation (a positive percentage if the account had an increase or a negative percentage if the account had a decrease) in the assets, liabilities, or income loss statement.
In the following example, we have the current portion of sublease receivable with 100% positive variation and cash and cash equivalents with 1.55% negative variation. The first have our special attention because it has more than 50%.
 |
Step #4
The analyst can start making questions about the variations; the first one could be which sublease did the company celebrate? In which operations or inversions the company expended cash?
You could have that information having an interview with the accounting department, the administrator, or even directly with the company’s owner, also. If the financial statement has been audited, you could read its notes.
With this method and the vertical method, it is essential to be sure about the accounts you are reviewing and investigate a lot about them. Make questions, look for supporting documents and call an expert if necessary.
Written by: Andrea Diaz
Related Articles:
Newsletters
Newsletter – August 2020
NewslettersEvents & SponsorshipArticles & Publications
Newsletter – July 2020
NewslettersEvents & SponsorshipArticles & Publications
Newsletter – May 2020
NewslettersEvents & SponsorshipArticles & Publications
Newsletter – April 2020
NewslettersEvents & SponsorshipArticles & Publications
Newsletter – March 2020
NewslettersEvents & SponsorshipArticles & Publications
Events & Sponsorship
No Results Found
The page you requested could not be found. Try refining your search, or use the navigation above to locate the post.
Articles & Publications
Lockdown Program and Worker Lockdown Benefit
The Government of Canada Temporarily Expands Access to Lockdown Program and Worker Lockdown Benefit From: Department of Finance Canada News release December 22, 2021 - Ottawa, Ontario - Department of Finance Canada The Government of Canada is committed to supporting...
Legislation to create jobs and implement targeted COVID-19
Legislation to create jobs and implement targeted COVID-19 support receives Royal Assent From: Department of Finance Canada News release December 17, 2021 - Ottawa, Ontario - Department of Finance Canada Today, the Honourable Chrystia Freeland, Deputy Prime Minister...
How to Register for My Business Account
How to Register for My Business Account If you are a business owner and haven't registered your business account with CRA, we encourage you to watch the video or follow the steps below. To get started, go to canada.ca/my-cra-business-account and select "CRA register."...
Essential tax numbers for 2022
Essential tax numbers: updated for 2022 Use this handy list of tax numbers as a quick reference. Working individuals Maximum RRSP contribution: The maximum contribution for 2022 is $29,210; for 2021, it’s $27,830. The 2023 limit is $30,780. TFSA limit: In 2022, the...
December Year-End Readiness Update
December Year End Readiness Update Year-End is almost here! RGB Accounting and ADP want your Year-End to be less stressful and less work. After processing your last payroll for 2021, ADP will automatically run a new Tax Form Trial Run Report. What should you do?...